 The Web Monitor Main Form
 The Web Monitor Main Form
The Web Monitor main form acts as the control center for all monitoring activities. It provides the ability to view current status as well as the starting point for adding, editing, deleting and otherwise updating the Web Monitor Site list.
Viewing Status
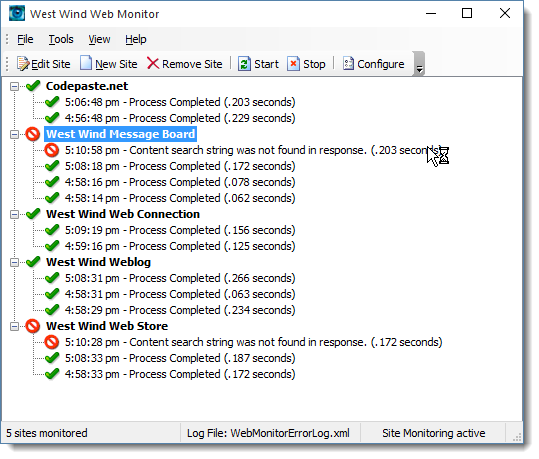
The main form allows viewing the current status of all the active sites in a tree format. The top level nodes of the tree show the various sites with the latest status information displayed. Drilling into the tree allows reviewing the last three requests performed and their status. There are three modes that status information returns:
- Green
The request succeeded in time, and returned the expected result.
- Red
The request failed either because the server wasn't responding, the request timed out or the result did not contain the expected response.
- No Icon
The request is currently processing. This means the request was started but hasn't completed running yet and has not timed out.
Adding, Editing and Removing Site Info
Via the menu and toolbar you can add remove and edit individual site info. Site info contains details about the URL to monitor and what actions to take in case of failure.
Editing Configuration Settings
The Configure button on the toolbar allows you to set global configuration settings for Web Monitor. The settings made here apply to all the sites. Things you set here include the mail server to use for notifications, Proxy configuration, default information for site entries as well as configuration of the run mode of Web Monitor (Standalone, Tray Icon or Service).
Log Viewer
You can also use Tools Menu and the Log Viewer option to quickly review the log files of the requests that have accumulated. You can view both the detail request log of all the check requests that occurred as well as the error log that simply displays the failures.

Comment or report problem with topic